

Most projects aren’t suffering from a lack of data, but most people would say they are drowning in it.
The challenge doesn’t come with finding numbers in an era of big data, but with finding the truth hidden within them.
To harness data effectively you will want to move beyond mere collection and toward mastery, using information not as a decorative accessory but as a precision instrument that carves a path to success. Let’s break it down!

The Philosophy of Purposeful Data Usage
Think of data as a high-resolution map. If you are trying to navigate a dense forest, a map is useless if you don’t know where you’re going or if you don’t know how to read the topography.
Many project managers treat data like a security blanket, gathering every possible point of information in hopes that “having it” will equate to “using it.”
Purposeful data usage starts with a shift in mindset: data is a servant to your business strategy, not the master of it. It requires a certain level of intellectual humility to realize that your gut feeling might be wrong, paired with the courage to follow what the evidence suggests.
When you approach your project with this philosophy, you stop asking “What data can we get?” and start asking “How can we best analyze data to solve the problem?”

This subtle shift prevents analysis paralysis and ensures that every byte of information serves a specific, tangible goal.
Identifying Your Project’s North Star Metrics
Every successful project needs a “North Star” – a single, guiding metric that best captures the core value your project delivers.
If you are building a mobile app, your North Star might be daily active users. If you are streamlining a manufacturing process, it might be the cycle time per unit.

Without this fixed point, your team will wander, distracted by every minor fluctuation in the periphery.
Distinguishing Between Vanity and Actionable Metrics
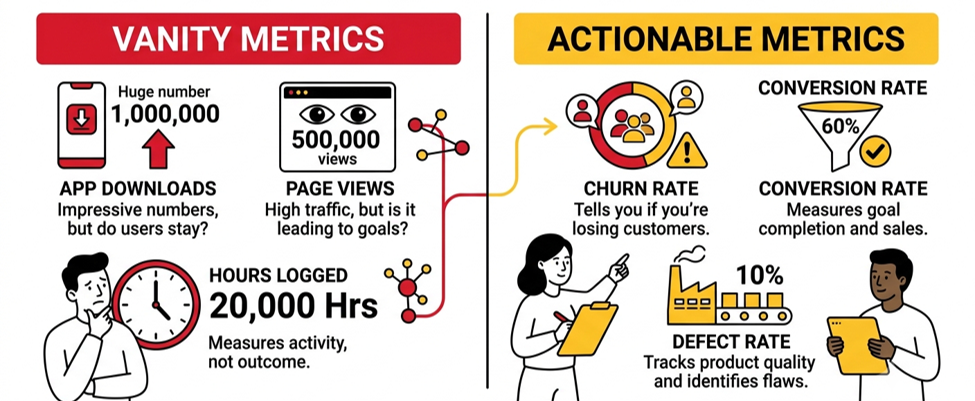
It is easy to get seduced by vanity metrics. These are the numbers that look great on a slide deck but don’t actually correlate with success.
Total downloads, raw page views, or the number of hours your team logged are often vanity metrics; they make you feel good but offer no guidance on what to do next.
Actionable metrics, by contrast, tell you exactly where to turn the wheel. A high “bounce rate” on a specific page tells you that the content is misaligned with the audience demographics.
A high “churn rate” tells you your product isn’t providing long-term value. While vanity metrics tell you where you’ve been, actionable metrics tell you where you need to go.
If a number doesn’t help you make a decision, it’s just noise.
The Art of Asking the Right Questions
Data only speaks when it is spoken to. The quality of your insights is directly proportional to the quality of your questions.
Instead of asking “How are we doing?”, ask “Which specific feature is causing users to drop off during the onboarding process?”
Mastering this art requires you to be a bit of a detective. You must dig beneath the surface. If sales are up, don’t just celebrate – ask why.
Was it a seasonal trend, a specific marketing campaign, or a competitor’s failure? By interrogating the data with “Why?” and “How?”, you move from passive observation to active investigation.
Foundational Data Collection: Quality Over Quantity
The digital age has made us hoarders. We store terabytes of data “just in case.”
However, in project management, more data without a structured way to perform data analysis often leads to more confusion. The foundation of a data-driven project isn’t the size of the database; it’s the data governance, data quality, and the integrity of the information within it.

You are better off with ten reliable data points than ten thousand questionable ones.
Establishing Clean Data Pipelines
A data pipeline is the journey information takes from the moment it is generated to the moment it sits on your dashboard.
If this journey is messy, if data is being manually entered into spreadsheets, or if different software tools aren’t “talking” to each other – you create gaps where errors thrive.
Building a clean pipeline means you must automate as much as possible and ensure consistency.
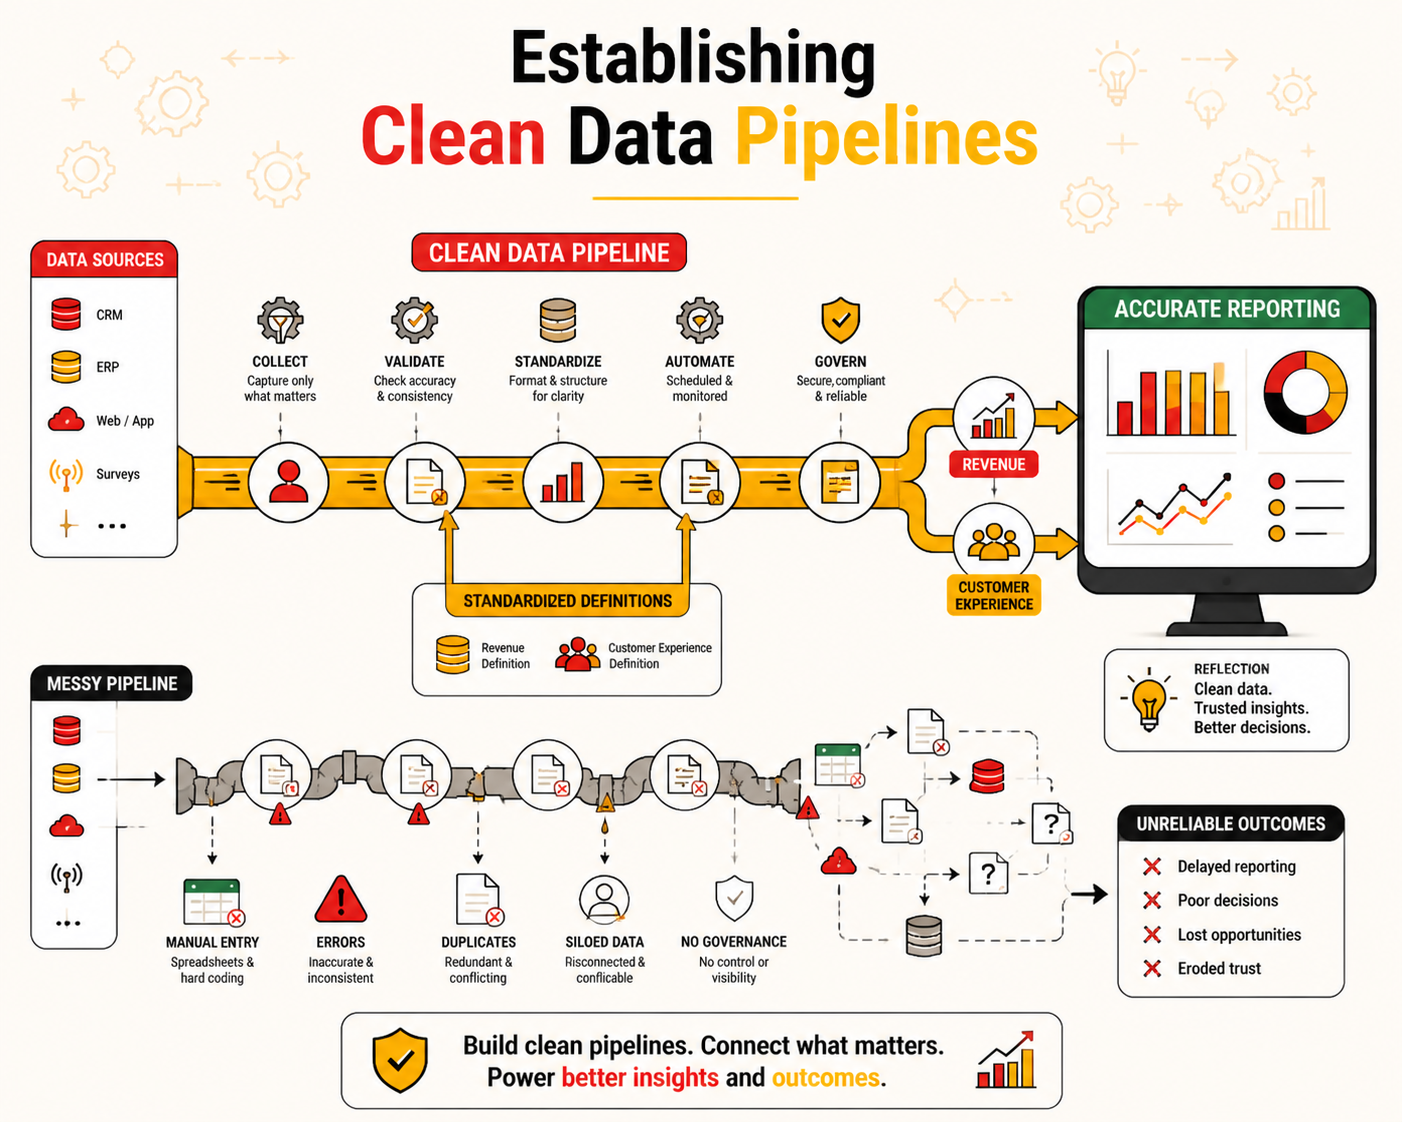
If one department measures “success” by revenue and another by customer experience and satisfaction, your pipeline is fractured. Standardize your definitions early.
Clean pipelines ensure that when you look at a report, you are seeing reality, not a distorted reflection caused by technical friction.
The “Garbage In, Garbage Out” Rule
Computer scientists have a saying: “Garbage In, Garbage Out” (GIGO).
If your initial data collection is flawed, perhaps due to a poorly designed survey, a broken tracking pixel, or biased sampling – no amount of sophisticated analysis can save it.

Imagine baking a cake with spoiled ingredients. It doesn’t matter how advanced your oven is; the end result will be unpalatable.
Before investing in expensive analytics software:
- Automate pipelines to eliminate manual Excel entry errors.
- Standardize definitions across departments (e.g., ensure Marketing and Engineering define a “qualified lead” the exact same way).
- Be ruthless about discarding corrupted or incomplete data points.
Turning Raw Information into Narrative Insights
Data in its raw form is just a collection of symbols. To make it useful, you must transform it into actionable insights and a story.
Human beings are not wired to remember spreadsheets; we are wired to remember narratives. Your job is to find the “plot” within the numbers.
Human brains aren’t wired to remember spreadsheets; we are wired to remember stories.
Your job as a project leader is to find the “plot” hidden inside the numbers.
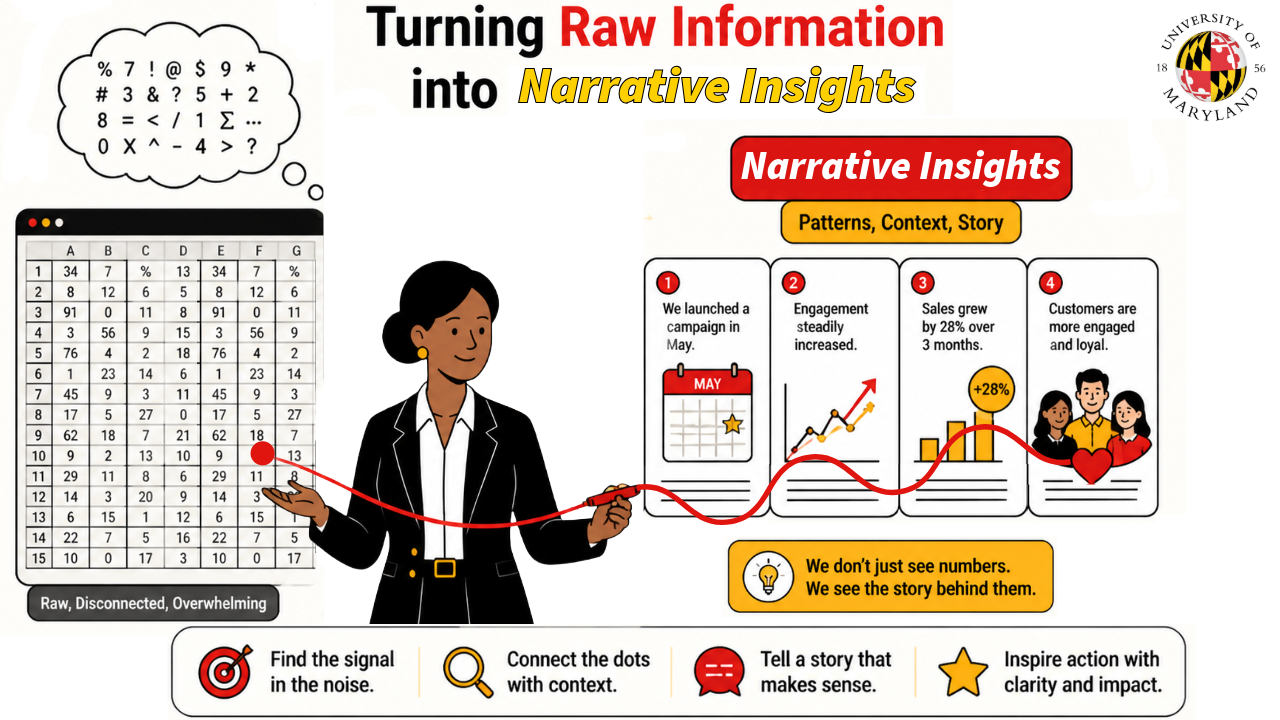
- Look for Patterns, Not Outliers: Don’t panic over a single daily blip. Zoom out to spot recurring trends, like a performance drop that happens every Tuesday or a 40% higher renewal rate among newsletter subscribers.
- Always Provide Context: A 10% growth rate sounds great in a vacuum. But if the industry average is 50%, that 10% is actually a warning sign. Always anchor your numbers to a baseline or benchmark.
Building a Data-Informed Team Culture
Harnessing data shouldn’t be the job of a single “data person.” For a project to truly thrive, a data-driven culture and data literacy must be woven into the fabric of the team.
This doesn’t mean everyone needs to be a statistician, but everyone should understand how their work impacts the North Star metrics.

Democratizing Access to Information
Secrets are the enemy of efficiency. When data is siloed within one department, it creates bottlenecks and resentment.
Democratizing data means creating shared dashboards where every team member – from the intern to the CEO, can see the project’s health in real-time.
When people have access to the “why” behind a decision, they are more engaged.
They stop working on tasks simply because they were told to and start working because they can see the direct impact of their efforts on the charts that matter.
Encouraging Data-Driven Decisions at Every Level
A data-informed culture is one where the best idea wins, regardless of who it came from. In many organizations, the “Highest Paid Person’s Opinion” (HiPPO) carries the most weight.
Data is the great equalizer.
Encourage your team to bring evidence to the table. If a designer wants to change a layout, ask for the heat-map data that supports it. If a developer wants to refactor code, ask for the performance metrics.
When you normalize the use of data in daily conversations, you reduce ego-driven conflict and foster a culture of objective data-driven decision-making.
The Feedback Loop: Iterating Based on What the Data Tells You
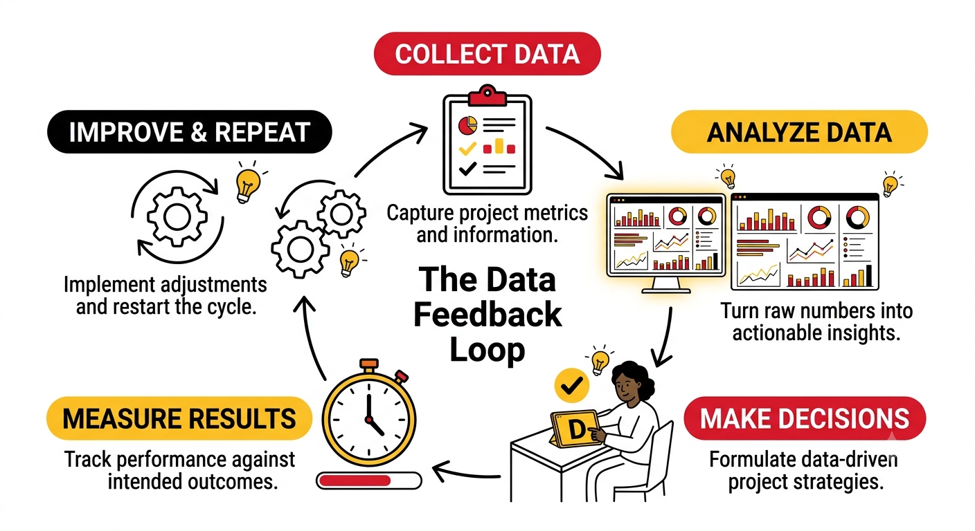
The most powerful aspect of data is its ability to create a feedback loop. You act, you measure the result, and you adjust.
This cycle is the heartbeat of modern project management. It allows you to fail fast and small so that you can succeed big later.
When to Pivot and When to Persevere
Data can be a harsh truth-teller. Sometimes, the numbers will show that your favorite feature is being ignored or that your marketing strategy is falling flat.
This is where the “pivot” comes in. A pivot isn’t a failure; it’s an informed course correction.
However, be careful not to pivot too early. Some strategies take time to yield results (lagging indicators). Use your data to determine if a lack of results is due to a fundamental flaw in the idea or simply a lack of “runway.”
If the trend is moving in the right direction but at a slow pace, persevere. If the trend is flat or declining despite your best efforts, it’s time to pivot.
Continuous Improvement Through A/B Testing
A/B testing is the ultimate expression of data-driven iteration. By showing “Version A” to one group and “Version B” to another, you remove guesswork.
This scientific approach allows you to make incremental improvements that compound over time.
Whether it’s testing two different email subject lines or two different pricing tiers, A/B testing provides empirical proof of what works.
Over the course of a project, these small 1% gains add up, eventually creating a massive competitive advantage that your competitors – who are likely still guessing, won’t be able to match.
Moving Forward: Tools and Habits for Long-Term Success
Harnessing data is not a one-time setup; it is a lifelong discipline.
Invest in tools that scale with you– whether it’s robust analytics platforms like Google Analytics or Mixpanel, or project management tools that support seamless data integration and visualization.
But more important than the tools are the habits. Set aside time every week for a “data deep dive.”
Review your North Star metrics, check the integrity of your pipelines, and ask the hard questions. Stay curious, stay objective, and remember that data – whether processed by human intuition or machine learning – is not there to tell you how great you are doing; it’s there to tell you how much better you could be.
By mastering the flow of information, you don’t just manage a project; you lead it with a level of clarity and confidence that only the truth can provide.
FAQ’s
Q: What is the difference between vanity metrics and actionable metrics in project management?
A: The fundamental difference lies in decision-making value:
- Vanity Metrics: Surface-level numbers that look impressive on presentation decks but offer no real strategic value or correlation to success (e.g., total app downloads, raw page views, or total hours logged).
- Actionable Metrics: Specific data points that clearly indicate what operational adjustments to make (e.g., high page bounce rates or customer churn rates that signal underlying product flaws).
Q: What is a North Star metric, and why does every project need one?
A: A North Star metric is a single, key metric that best captures the core value and success a project delivers to its target audience. Every project needs one as a fixed anchor to keep the team aligned and focused, preventing them from wandering or getting distracted by minor, peripheral data fluctuations.
Q: What does the “Garbage In, Garbage Out” (GIGO) rule mean for data pipelines?
A: The “Garbage In, Garbage Out” rule states that if your initial data collection is flawed—due to corrupted tracking, biased sampling, or poor survey design—no amount of advanced analysis or expensive software can yield accurate insights. To prevent GIGO, project managers must automate data pipelines and standardize definitions across departments.
Q: How can a project team eliminate the “HiPPO” effect using data?
A: Teams eliminate the HiPPO (Highest Paid Person’s Opinion) effect by using verifiable data as an equalizer in daily discussions. Instead of making strategic choices based on seniority or gut feelings, team members are encouraged to bring empirical proof—such as heat maps or performance metrics—so that the best evidence-backed idea wins regardless of who proposed it.
Q: How does A/B testing support continuous improvement in project execution?
A: A/B testing supports continuous improvement by showing “Version A” to one user group and “Version B” to another, removing guesswork through scientific comparison. This empirical testing allows project teams to make small, data-backed incremental improvements that compound over time to create a massive competitive advantage.
Q: Where can I get professional training to master data analytics and data-driven project leadership?
A: You can master data governance, analytics pipelines, and data-driven project frameworks through the specialized programs at the University of Maryland Project Management Center for Excellence. Learn more about our advanced project management tracks or sign up for an information session. For those that need to get up to speed quickly with modern leadership tools, learn more about our professional training options and enroll today.
