
Ever feel like you’re navigating a project with a blindfold on, relying more on gut feelings than concrete facts? You’re not alone.
In the fast-paced world of project management, instinct can get you started, but data-driven decision-making is what truly propels you to consistent success. It’s about shifting from “I think” to “I know,” transforming your hunches into powerful, evidence-based choices.
This guide isn’t about becoming a data scientist overnight. It’s about empowering you, the project manager, to leverage the wealth of information at your fingertips, making smarter, more strategic decisions that directly impact your project’s bottom line.
We’ll walk through a practical roadmap, step by step, to embed data into the very fabric of your project management process. Get ready to unlock a new level of project success!

Why Data-Driven Decisions Are Your Project’s Secret Weapon
Think about a skilled poker player. They don’t just bet on a good feeling; they observe their opponents, calculate probabilities, and analyze past hands. Similarly, in project management, data is your strategic advantage. It reduces risk, enhances predictability, and ultimately, increases the likelihood of a successful outcome.
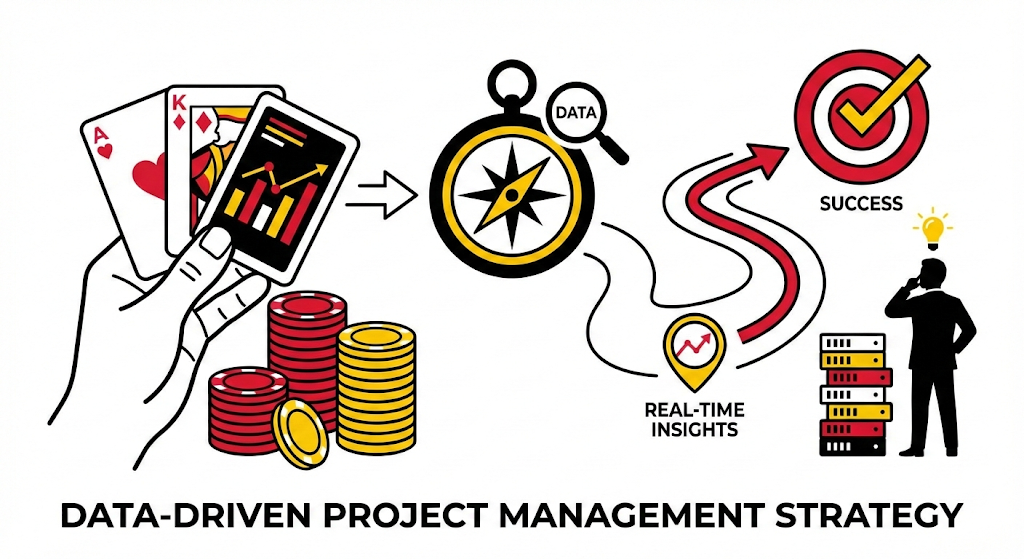
When you base decisions on data, you move beyond subjective opinions. You can proactively identify potential roadblocks before they become crises, optimize resource allocation for maximum efficiency, and demonstrate the true value of your work with quantifiable results.
It’s the difference between guessing where your project is headed and having a GPS with real-time traffic updates.
This approach fosters trust with stakeholders, empowers your team with clear insights, and positions you as a forward-thinking leader.
Laying the Foundation: What Data Do You Need?
Before you can start analyzing, you need to know what to look for. This initial step is crucial – it’s like deciding what ingredients you need before you start cooking.
Don’t just collect data for data’s sake; focus on what truly matters to your project’s health and objectives.
Start by revisiting your project goals and key performance indicators (KPIs). What metrics directly reflect progress towards those goals?
- For a software development project, this might be “bug fix rate,” “sprint velocity,” or “mean time to resolution.”
- For a marketing campaign, it could be “conversion rate,” “customer acquisition cost,” or “website traffic.”
Think about the classic project constraints: scope, time, cost, and quality.
What data points shed light on these areas?
Consider data related to:
- Schedule Performance: Actual vs. planned dates, critical path analysis, lead time, cycle time.
- Cost Performance: Actual vs. budgeted expenditures, earned value management metrics (CV, SV, CPI, SPI).
- Resource Utilization: Team member workloads, resource allocation vs. capacity, skill gaps.
- Quality: Defect rates, customer satisfaction scores, adherence to standards.
- Risk: Number of open risks, probability and impact scores, risk mitigation effectiveness.
- Stakeholder Engagement: Feedback surveys, meeting attendance, communication effectiveness.

The key is to be selective. Too much data can be overwhelming, leading to “analysis paralysis.”
Focus on a manageable set of relevant, measurable, and actionable metrics that provide a clear picture of your project’s status and trajectory.
Step-by-Step: Implementing Data-Driven Decisions
Now, let’s roll up our sleeves and get into the practical application. This isn’t a one-and-done process; it’s a continuous cycle of collection, analysis, and adaptation.
1. Define Clear Objectives and Metrics
Every journey needs a destination.
Before you even think about data, clearly articulate what you’re trying to achieve with your project and how you’ll measure that success. This isn’t just about the project’s end goal; it’s about intermediate milestones and performance targets too.
Imagine you’re managing a project to launch a new e-commerce feature.
Your objective might be: “Increase average order value by 15% within three months of launch.”
The corresponding metrics would be: “average order value” (AOV) tracked daily/weekly, and potentially “conversion rate from feature engagement.”

Without these clear definitions, your data collection efforts will be unfocused, and you won’t know if your decisions are actually moving the needle.
Ensure your metrics are SMART: Specific, Measurable, Achievable, Relevant, and Time-bound. This clarity creates a direct link between the data you collect and the strategic outcomes you desire.
2. Establish Data Collection Mechanisms
Once you know what data you need, the next step is figuring out how you’ll get it.
This is where you set up the plumbing for your data pipeline. Don’t rely on ad-hoc requests or manual spreadsheets alone; aim for automation and consistency wherever possible.
This involves identifying your data sources. Are you pulling from project management software (like Jira, Asana, Trello), financial systems (QuickBooks, SAP), CRM platforms (Salesforce), time-tracking tools, or survey responses?

For instance, your project management software can automatically track task completion rates, sprint velocity, and bug reports. Your accounting system will provide actual costs.
User feedback platforms can give you qualitative and quantitative insights into user satisfaction.
Investigate tools that can centralize this data or at least make it easily accessible. Many modern project management platforms offer built-in reporting.
If not, consider using business intelligence (BI) tools or even robust spreadsheet software with integrations to pull data in regularly. Document your data sources, collection frequency, and the individuals responsible for ensuring data accuracy.
The cleaner and more consistent your data input, the more reliable your insights will be.
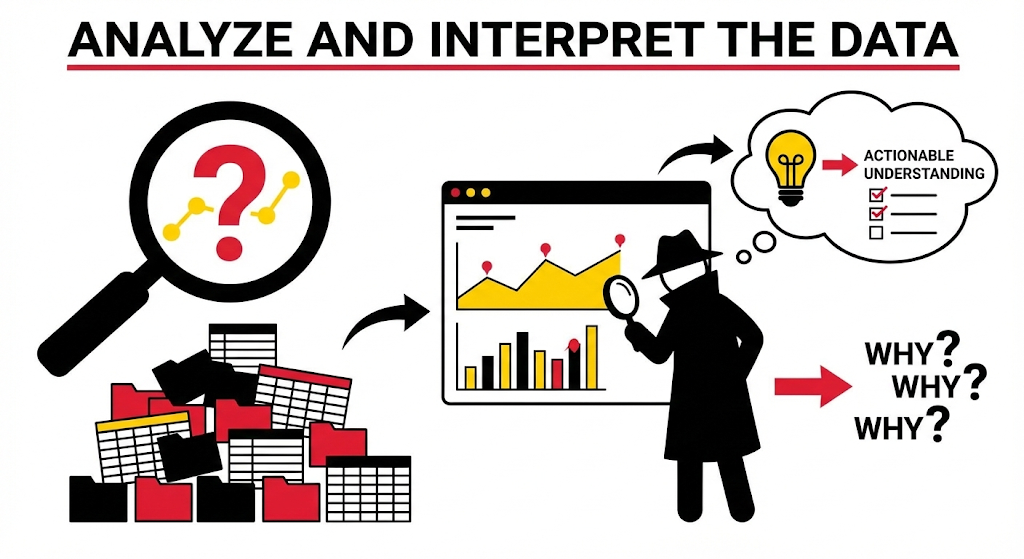
3. Analyze and Interpret the Data
Collecting data is only half the battle; the real magic happens when you analyze it to extract meaningful insights. This is where you move from raw numbers to actionable understanding.
Think of yourself as a detective, piecing together clues to form a coherent story.
Start by visualizing your data. Charts, graphs, and dashboards make complex information digestible and reveal trends that might be hidden in tables of numbers.
Are you seeing an upward trend in critical bugs? Is your team’s sprint velocity consistently declining? Are actual costs significantly diverging from your budget?
Look for patterns, anomalies, and outliers.
Don’t just stare at the numbers; ask “why?” If the “time to complete task” metric is consistently higher than estimated, investigate the root causes.
Is it resource constraints, unclear requirements, or skill gaps?
Compare current performance against baselines, targets, and historical data. Utilize statistical methods if appropriate, but often, simple trend analysis and comparisons are enough to spark important conversations.
This phase is about translating raw data into clear, concise answers to your “why” questions.
4. Formulate Data-Driven Decisions
This is the pivotal moment: transforming your insights into concrete actions. Analysis without action is just an interesting observation.
Your goal here is to leverage the “why” you uncovered in the previous step to inform your “what next?”
Let’s say your analysis showed that a particular team member is consistently over capacity, leading to missed deadlines and a dip in quality on their tasks.
A data-driven decision might be to reallocate some of their workload, provide additional training, or even hire another resource if the trend is systemic.

When formulating decisions:
- Be specific: “We need to improve efficiency” is not a decision. “We will implement a new daily stand-up structure to identify blockers earlier, aiming to reduce cycle time by 10% in the next sprint” is.
- Connect to objectives: Ensure your decision directly addresses a problem or opportunity identified through data and aligns with your project objectives.
- Consider trade-offs: Every decision has consequences. Data can help you weigh the pros and cons of different options. What’s the cost of reallocating resources versus the cost of continued delays?
- Involve stakeholders: Share your findings and proposed solutions with relevant team members and stakeholders. Their input can enrich the decision and foster buy-in.
Remember, a data-driven decision isn’t always about a dramatic pivot. Sometimes, it’s about making small, incremental adjustments based on continuous monitoring.
5. Implement, Monitor, and Adjust
Making a decision is only the beginning. The real test is in its execution and whether it produces the desired outcome. This step closes the loop, turning your data-driven decision-making into a continuous improvement cycle.

Once you implement a decision, you must establish new metrics or continue monitoring existing ones to track its impact. If you reallocated a team member’s workload, how did that affect their task completion rate, quality, and overall team velocity? Did the new stand-up structure actually reduce cycle time?
Set a clear timeframe for monitoring and define what success looks like for that particular decision.
If the data shows that your decision isn’t having the intended effect, don’t be afraid to adjust. This isn’t a failure; it’s an opportunity to learn and refine your approach.
Perhaps your initial hypothesis was incorrect, or new variables have emerged. Data provides the feedback loop you need to iterate and optimize your project plan, ensuring you’re always steering towards success with the most current and accurate information.
This iterative process is the hallmark of true data-driven project management.
Common Pitfalls and How to Avoid Them
Even with the best intentions, data-driven decision-making can stumble. Being aware of these common pitfalls can help you navigate around them.

Analysis Paralysis
This happens when you collect too much data or spend too much time analyzing without ever making a decision. Remember, perfect information is rarely available, and sometimes good enough data, acted upon swiftly, is better than perfect data that never sees the light of day. Set time limits for analysis and focus on extracting key insights.
Confirmation Bias
Where you interpret data in a way that confirms your existing beliefs or assumptions. Actively seek out contradictory evidence and encourage diverse perspectives during analysis. Ask questions like, “What if we’re wrong?” or “What else could this data be telling us?”
Poor Data Quality
If your data is inaccurate, incomplete, or inconsistent, your decisions will be flawed. Invest time upfront in establishing robust data collection processes and periodically audit your data for integrity. Garbage in, garbage out, as the saying goes.
Ignoring Qualitative Data
While numbers are powerful, feedback from team members, stakeholders, and end-users provides crucial context and understanding that quantitative data alone cannot. Combine both to get a holistic view.
The Future of Project Management is Data-Driven
Embracing data-driven decision-making isn’t just a trend; it’s becoming an essential competency for modern project managers.
It transforms you from a reactive problem-solver into a proactive strategist, armed with undeniable evidence to guide your projects.
By systematically defining your objectives, collecting relevant data, analyzing it critically, and making informed decisions, you’ll not only improve project outcomes but also elevate your credibility and leadership.
Begin small, iterate, learn from your experiences, and watch as your projects move from good to truly exceptional.
The data is waiting; it’s time to unlock its power.
Project Management Symposium
Looking to hear more insights from Industry Experts?

You should join us at this year’s Project Management Symposium.
Visit our Website HERE to learn more!
Project Management Programs
Are you looking to expand your project management skills?
With more than 50 courses and 17 professional certifications, our programs are built by industry experts and UMD faculty to address real-world challenges in today’s workplaces.

Some of our most popular certifications include:
- Agile Project Management – Navigate complex projects with adaptive frameworks.
- Construction Management – Strengthen your management expertise in construction projects.
- Artificial Intelligence in Government Procurement – Unlock the power of artificial intelligence to revolutionize government procurement.
- Project Management Professional (PMP) Exam Prep Training – Prepare for the PMP exam with confidence.
